
Bogus Stats: On the Countercyclical Nature of the Strikeout and How Willy Taveras May Have Ruined the Global Economy
>> Friday
These days, it seems that every social trend is somehow explained within the context of the current economic recession, whether it be people drinking more Clamato, more kids going to grad school, or increased sales of Ayn Rand books.
Of course, no one has adequately answered the question that really matters: How will this impact baseball?
Now, when I say "baseball," I don't mean salaries or naming rights or concessions prices--I'm talking the on-field action. How will the recession afftect the way the game of baseball is played?
Fortunately, I took the time to answer that question using the best statistical tools I have--limited data and improper methods.
I was specifically interested in the relationships between the four most stylistically distinct plays in baseball--the walk, the strikeout, the home run (a.k.a. the Three True Outcomes), and the stolen base--and three economic indicators that are simple enough for me to grasp--gross domestic product, consumer price index, and unemployment rate.
Unfortunately, my lack of access and/or inability to find year-to-year league-wide rates in each category forced me to adopt the highly inadequate alternative of summing the totals of the two league leaders for each year. This works ok in general--at least in getting a vague sense for major shifts in strategy trends, such as the Astroturf-inspired go-go '80s--but it's really, really misleading when a guy like Ruth (HR) or Bonds (BB) comes along and totally laps the field in a particular category for a few seasons. But... I am only one man with only one hour lunch break per day, so rampant imperfection is what you get.
Below are the results. In each of the time series graphs, unemployment rate (red) and the statistical baseball category (blue) are expressed as ratios relative to their mean over the course of the available data years. As you can see, unemployment statistics do not date back to the Great Depression, which is convenient in terms of axis range and in generating a mean unemployment rate (5.6% for the years available) that is less distorted by outlying values.
(Note: I made no adjustments for season length or strike-shortened years, and I don't really feel like going back, and correcting it now. With the exception of the 1994 home run total, there are noticeable downward spikes in 1981 and 1994 for each category.)
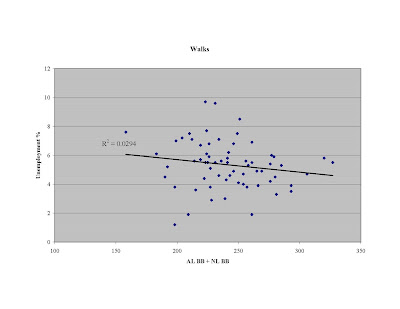
The scatter-plots pair the statistical category (x-axis) with unemployment rate (y-axis). 


 Observations:
1) There's not much to be gathered from the walk totals, as there are really no major long-term trends or large fluctuations, other than the Bonds-boom in the aughts.
2) Beginning in the late-'60s or so, a countercyclic trend between unemployment and both home runs and walks seems to emerge. Of course, this makes perfect sense: As the economy begins to sag, people become more risk-averse and, consequently, adopt more conservative behaviors, such as investing in government bonds, driving more slowly, and cutting down their swing with two strikes.
3) While the correlation between stolen bases and unemployment is relatively large--considering the null hypothesis is r^2=0--all this really shows is that both happened to sag in the '40s and climbed together for a spell in the '80s. Of course, if we had the unemployment data during the Great Depression, there would be a smattering of points way in the upper left (few stolen bases, historic levels of unemployment), which even more proves why the apparent correlation is a mirage. In fact, I have no idea why I even bothered with these scatter-plots.
4) If you look very closely / trick yourself into seeing things, there does appear to be a lead-lag effect with stolen bases and unemployment, with unemployment rising and falling in response to stolen base totals. If you buy this, then we can blame the rebirth of the stolen base's popularity the last five years for putting this recession in motion.
5) On the other hand, if we had unemployment data from the roring '20s and the Depression, we'd be inclined to say that unemployment is the lead, and stolen bases are the lag. Note the drop in stolen bases in the '30s and subsequent years of low stolen base totals--again, a possible indication of a risk-averse society.
6) Beyond the volatile Depression / WWII / postwar eras, there is one distinct period of time when the CPI (yellow) grew appreciably faster than GDP (green) over the last seventy years--the early- to mid-'70s. What could be the explanation? No, not some silly policy initiative or international trade law. Free agency! Baseball free agency caused an unusually rapid influx of millions of dollars of money into the consumer economy without any productive growth--hence inflation, hence jump in CPI.
Anyway, that's the extent of my nonsense. Would anyone else like to distort their senses and offer up other conclusions? And Matt--"You're an unconscionable fag" doesn't count this time.


4 comments:
Am I wrong in concluding that stolen bases have a high correlation to the unemployment rate? I think the "risk aversion" hypothesis falls apart with the stolen base analyses, right?
Yeah, but as I said, the strong correlation seems to be the product of their extremes--'40s/'50s on the low end and late '70s/'80s on the high--just so happening to overlap. The middle doesn't look like much to me. Plus, the '30s (if the unemployment data existed) would screw everything up (lowest SB totals, highest unemployment). If you look at the short-term fluctuations, you can convince yourself that higher levels of employment are followed by higher stolen base totals in subsequent years. Of course, since this is all nonsense, that probably isn't true either.
I so have no idea what I just read here, but I think it caused an anuerysm. I can just have my lawyer contact your lawyer, right?
Vanessa
http://www.wideawakeinwonderland.com
Want To Increase Your ClickBank Banner Commissions And Traffic?
Bannerizer makes it easy for you to promote ClickBank products with banners, simply visit Bannerizer, and get the banner codes for your favorite ClickBank products or use the Universal ClickBank Banner Rotator Tool to promote all of the ClickBank products.
Post a Comment